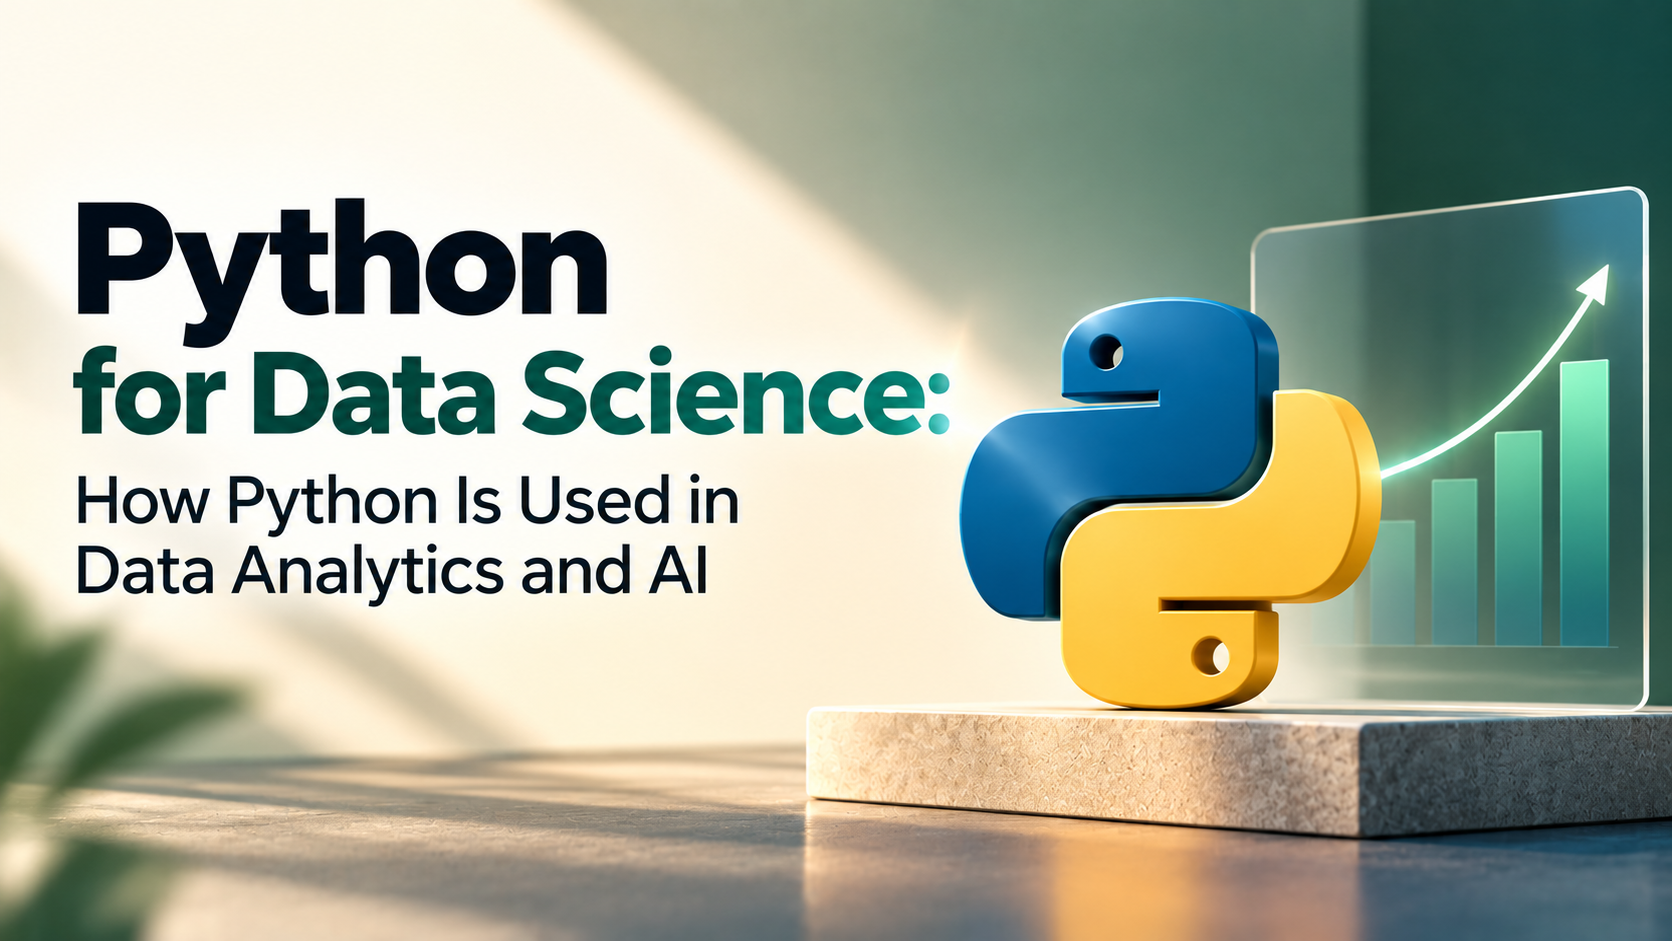
Python for Data Science: How Python Is Used in Data Analytics and AI
Python for data science has become a practical starting point for students and professionals who want to work with data analytics, machine learning, artificial intelligence, and automation. Its readable syntax is only one part of the reason. The larger advantage is the ecosystem around Python, which allows a learner to move from collecting and cleaning data to analysing patterns, creating visualizations, building machine learning models, and developing data-driven applications.
However, learning Python syntax alone does not make someone a data scientist. Data science requires programming, statistics, data preparation, analytical thinking, visualization, model evaluation, and the ability to communicate what the data actually means.
This guide explains how Python fits into a real data science workflow, which libraries are commonly used, what beginners should learn first, how data analytics differs from AI and machine learning, and how to build projects that demonstrate practical data skills.
What Is Python for Data Science?
Python for data science means using Python and its surrounding tools to collect, clean, transform, analyse, visualize, and model data.
A typical workflow might begin with a spreadsheet, CSV file, database, or API. Python can then be used to inspect the data, identify missing values, clean inconsistent records, calculate statistics, create visualizations, and eventually build a machine learning model if the problem actually requires one.
This makes Python useful across several stages rather than only at the machine learning stage.
Why Is Python Popular in Data Science?
Python is useful in data science because several parts of the workflow can be handled within one programming ecosystem.
- It has relatively readable syntax.
- It has mature libraries for numerical computing.
- It supports structured data manipulation.
- It provides extensive visualization tools.
- It has a large machine learning ecosystem.
- It can connect with databases and APIs.
- It supports automation and repeatable analysis.
- It can be used to build applications around trained models.
The important point is that Python does not replace statistical or analytical knowledge. It provides tools that make it easier to apply that knowledge to real datasets.
Python Fundamentals for Data Science: Where to Begin
A beginner should not start data science by immediately training machine learning models. The first step is to become comfortable with Python programming itself.
Variables, data types, conditions, loops, functions, lists, dictionaries, file handling, and exception handling provide the foundation for working with data.
Once these concepts are comfortable, a learner can begin working with libraries designed for data analysis. This is also where a structured Python learning path can help connect programming fundamentals with practical projects instead of treating data science as a completely separate subject.
Python Data Science Workflow
A useful way to understand Python's role in data science is to look at the workflow as a sequence of decisions.
| Stage | Typical Task | Python's Role |
|---|---|---|
| Problem Definition | Define the business or analytical question | Helps implement the eventual analysis |
| Data Collection | Obtain data from files, databases or APIs | Data loading, API requests and database connections |
| Data Cleaning | Handle missing and inconsistent values | Transformation and validation |
| Exploration | Find patterns and relationships | Calculations, grouping and statistical analysis |
| Visualization | Present trends and distributions | Charts and visual analysis |
| Modeling | Predict or classify outcomes | Machine learning libraries |
| Evaluation | Measure model or analysis quality | Metrics and validation |
| Deployment | Make results usable | APIs, applications and automation |
NumPy: Working with Numerical Data
NumPy is one of the foundational libraries in the Python data ecosystem. It provides arrays and numerical operations that are particularly useful when working with mathematical and scientific data.
A Python list is useful for general-purpose collections, while NumPy arrays are designed for efficient numerical operations.
Example
import numpy as np

marks = np.array([72, 81, 65, 90, 78])

print(marks.mean())
print(marks.max())
print(marks.min())
Instead of manually calculating each value, numerical operations can be performed directly on the array.
Understanding NumPy is useful because many data science libraries build on numerical array concepts.
Pandas: Cleaning and Analysing Data
Pandas is one of the most important Python libraries for data analysis. It provides structures such as Series and DataFrame that make tabular data easier to work with.
A DataFrame can represent information similar to a spreadsheet, but it can be manipulated programmatically and repeatedly.
Example
import pandas as pd

data = {
    "Name": ["Asha", "Riya", "Karan"],
    "Marks": [82, 74, 91]
}

df = pd.DataFrame(data)

print(df)
print(df["Marks"].mean())
With pandas, a learner can filter records, group data, sort values, create new columns, handle missing values, and combine datasets.
Why Data Cleaning Matters More Than Beginners Expect
A machine learning model cannot compensate for poor input data. If the dataset contains incorrect values, duplicated records, inconsistent categories, or missing information, the analysis can become misleading.
For example, suppose a customer dataset contains the following city values:
- Delhi
- delhi
- New Delhi
- Delhi NCR
These may represent overlapping locations, but a computer will initially treat them as different text values. Before analysing customers by location, the data needs a clear definition and appropriate standardization.
This is why data cleaning is not simply a technical preprocessing step. It requires understanding what the data represents.
Data Visualization with Python
Numbers can reveal patterns, but visualizations often make those patterns easier to identify.
Python can be used to create line charts, bar charts, histograms, scatter plots, box plots, and other visual representations.
Common Visualization Questions
- How have sales changed over time?
- Which category has the highest revenue?
- Is there a relationship between two variables?
- Are there unusual values?
- How is a numerical variable distributed?
The choice of chart should follow the question. A line chart may be useful for trends over time, while a scatter plot can help examine relationships between numerical variables.
Matplotlib and Seaborn
Matplotlib provides a flexible foundation for creating charts in Python. Seaborn builds on the Python visualization ecosystem and provides convenient statistical visualization capabilities.
Beginners should not focus on memorizing every plotting option. It is more useful to understand which visualization communicates a particular question clearly.
Python for Exploratory Data Analysis
Exploratory Data Analysis, or EDA, is the process of examining a dataset before making strong conclusions or building a predictive model.
EDA can involve:
- Checking the number of records and columns
- Understanding data types
- Finding missing values
- Checking duplicate records
- Examining distributions
- Calculating summary statistics
- Comparing groups
- Identifying unusual values
- Looking for relationships between variables
EDA is important because it can change the direction of the entire project. A dataset may initially appear suitable for machine learning but reveal through exploration that the target variable is poorly defined or that important information is missing.
Python for Machine Learning
Machine learning is one part of the broader data science workflow. It involves developing systems that learn patterns from data to make predictions, classifications, recommendations, or other decisions.
Python has a large machine learning ecosystem, making it possible to experiment with different algorithms without implementing every mathematical operation from scratch.
Common machine learning tasks include:
- Classification
- Regression
- Clustering
- Dimensionality reduction
- Recommendation
- Anomaly detection
Scikit-learn for Beginner Machine Learning
Scikit-learn is widely used for traditional machine learning workflows in Python.
A beginner can use it to train and evaluate models for classification, regression, clustering, preprocessing, and other common tasks.
Typical Workflow
- Load the dataset.
- Clean and prepare the data.
- Separate features and target.
- Split the data into training and testing sets.
- Choose an appropriate model.
- Train the model.
- Generate predictions.
- Evaluate the results.
The important lesson is that selecting a model should come after understanding the problem and the data. A more complicated algorithm is not automatically a better solution.
Data Analytics vs Machine Learning
Beginners often assume that becoming a data professional means immediately learning machine learning. That is not always necessary.
| Question | Data Analytics | Machine Learning |
|---|---|---|
| Primary Goal | Understand and communicate what the data shows | Learn patterns for prediction or decision-making |
| Typical Output | Reports, dashboards, insights | Predictions or classifications |
| Core Skills | SQL, statistics, data cleaning, visualization | Statistics, programming, modeling and evaluation |
| Python Role | Analysis and visualization | Data preparation, training and evaluation |
If a company simply wants to know which product category generated the most revenue last quarter, a machine learning model may add unnecessary complexity. A well-designed analysis may answer the question more effectively.
Machine learning becomes more relevant when the objective involves predicting an unknown outcome or automating a decision based on patterns in historical data.
Python for Artificial Intelligence
Artificial intelligence is broader than machine learning. Python is used in AI applications involving machine learning, natural language processing, computer vision, recommendation systems, generative AI, and intelligent automation.
For beginners, the most useful approach is to build the underlying programming and data skills first. Learning a collection of AI libraries without understanding data preparation, algorithms, evaluation, and basic programming can make it difficult to understand why a model behaves the way it does.
Python Libraries for Data Science
| Library | Common Use |
|---|---|
| NumPy | Numerical computing and arrays |
| Pandas | Data manipulation and analysis |
| Matplotlib | Data visualization |
| Seaborn | Statistical visualization |
| Scikit-learn | Traditional machine learning |
| TensorFlow | Machine learning and deep learning |
| PyTorch | Machine learning and deep learning |
Python for Data Science: What Should Beginners Learn First?
Trying to learn every data science library at the same time can create unnecessary confusion. A better approach is to build the skills in layers.
Stage 1: Python Programming
Learn variables, data types, operators, conditions, loops, functions, collections, files, and exception handling.
Stage 2: Data Handling
Learn NumPy and pandas and practise loading, cleaning, transforming, and analysing datasets.
Stage 3: Visualization
Learn how to communicate trends, distributions, comparisons, and relationships through appropriate charts.
Stage 4: Statistics
Understand descriptive statistics, probability, distributions, correlation, sampling, and other concepts relevant to the problems you want to solve.
Stage 5: Machine Learning
Learn supervised and unsupervised learning, model evaluation, feature preparation, and appropriate algorithm selection.
Stage 6: Projects
Build complete projects using real or realistic datasets and document the decisions made during the process.
Projects to Practise Python for Data Science
Projects are important because they expose problems that tutorials often hide. A dataset rarely arrives perfectly formatted and ready for a model.
| Project | Skills Practised |
|---|---|
| Student Performance Analysis | Pandas, statistics and visualization |
| Sales Data Analysis | Cleaning, grouping and business insights |
| Customer Churn Analysis | EDA, classification and evaluation |
| House Price Prediction | Regression and feature preparation |
| Customer Segmentation | Clustering and visualization |
| Weather Data Analysis | API data, cleaning and time-based analysis |
How to Build a Strong Data Science Project
A strong project should begin with a question rather than a library.
Start with a Problem
Instead of saying “I want to use machine learning,” define what you want to discover or predict.
For example, “Can we predict whether a customer is likely to leave?” is more useful than simply saying “I will build a classification model.”
Understand the Dataset
Before training anything, identify the columns, data types, missing values, duplicate records, unusual values, and target variable.
Create a Baseline
A simple baseline gives you something against which more advanced approaches can be compared. This prevents a complex model from appearing impressive simply because no simpler alternative was tested.
Choose Metrics Carefully
Accuracy is not always enough. In some classification problems, precision, recall, F1-score, or other metrics may provide a more useful picture of performance.
Explain the Result
A data science project should explain what the analysis discovered and what limitations remain. A model score without context does not tell the complete story.
Common Mistakes Beginners Make in Python Data Science
- Starting machine learning before learning basic Python
- Skipping data cleaning
- Using every available library without understanding its purpose
- Training a model without defining the problem clearly
- Using accuracy as the only evaluation metric
- Ignoring missing values and inconsistent data
- Creating charts without considering the question they should answer
- Copying notebook code without understanding each step
- Using a complex model when a simpler analysis would solve the problem
One of the most important habits is to question every transformation. If you remove a column, change a value, fill missing data, or select a feature, understand why the decision is being made.
Python for Data Science at Upskill Now
For learners who want to move from Python fundamentals toward practical development, Upskill Now's Python program provides a progression that includes programming logic, data structures, object-oriented programming, file handling, exception management, databases, automation, and APIs.
Projects such as the Expense Tracker, Student Management System, Employee Database Management, Weather Information Application, and final capstone can help learners practise the broader Python development skills that are useful before specializing further in data science or AI.
For someone specifically targeting data science, the next step should then include data analysis, statistics, visualization, and machine learning rather than assuming that general Python knowledge alone is sufficient.
Python for Data Science vs Python for General Development
| Area | General Python Development | Data Science |
|---|---|---|
| Core Python | Essential | Essential |
| Data Structures | Essential | Essential |
| File Handling | Important | Useful |
| Databases | Often important | Important |
| Statistics | Role dependent | Very important |
| Visualization | Role dependent | Very important |
| Machine Learning | Optional depending on role | Important for ML-focused roles |
When Should You Move from Data Analytics to Machine Learning?
You do not need to learn machine learning simply because it appears in a data science roadmap.
If your work mainly involves answering questions from existing data, building reports, identifying trends, and communicating business insights, strengthening analytics and statistics may provide more value than immediately studying advanced machine learning.
Machine learning becomes more appropriate when the problem requires prediction, classification, recommendation, pattern recognition, or automated decision-making based on historical data.
This distinction can save beginners considerable time. Learning more advanced technology is not always the same thing as solving the problem better.
Python Data Science Career Paths
Python can support several data-related career directions, but each role requires a different combination of skills.
| Role | Important Skills |
|---|---|
| Data Analyst | SQL, statistics, Excel or spreadsheets, Python, visualization |
| Data Scientist | Python, statistics, machine learning, data analysis |
| Machine Learning Engineer | Python, ML, software engineering, deployment and systems |
| AI Developer | Python, machine learning, AI frameworks and application development |
| Data Engineer | Python, SQL, databases, data pipelines and infrastructure |
The role determines what you should learn after Python. A data analyst does not need exactly the same skill set as a machine learning engineer, even though Python may be part of both workflows.
How to Build a Python Data Science Portfolio
A portfolio should show progression and reasoning rather than simply contain a collection of notebooks.
A practical portfolio can include:
- One exploratory data analysis project
- One visualization-focused project
- One SQL and Python data project
- One machine learning project
- One end-to-end project with clear documentation
For every project, explain the problem, dataset, cleaning decisions, analysis, methodology, results, limitations, and possible improvements.
For example, instead of writing “Built a customer churn prediction model,” explain what the target variable represented, how missing values were handled, which features were used, how the model was evaluated, and what the result means in practical terms.
What to Learn After Python for Data Science
Once your Python foundation is strong, your next topics can depend on your intended role.
- SQL for querying structured data
- Statistics for analytical reasoning
- NumPy and pandas for data manipulation
- Visualization for communicating insights
- Machine learning for predictive problems
- Git and GitHub for project management
- Databases for persistent data
- APIs for external data sources
- Cloud and deployment concepts for production-oriented roles
Do not try to master everything simultaneously. Build a foundation, choose a direction, and then deepen the skills that support that direction.
Conclusion
Python for data science is valuable because it connects programming with data analysis, visualization, machine learning, and AI through a broad ecosystem of tools. But the language itself is only the foundation.
A strong data science learner should understand how to define a problem, collect appropriate data, clean it carefully, explore it, select useful visualizations, apply suitable statistical or machine learning techniques, evaluate the results, and communicate the findings.
If you are starting from the beginning, learn Python fundamentals first and then move into data handling, statistics, visualization, and machine learning in a logical sequence. Upskill Now can provide a structured Python foundation with practical projects before you move toward a more specialized data science or AI learning path.
The goal should not be to use the most advanced model or the largest number of libraries. The goal is to use the right tools to answer the right question with reliable data and clearly explain what the results mean.
Contact Upskill Now
A-3, Third Floor, Rajouri Garden, New Delhi – 110027
Phone: 9999848160 | 9711448765
Email: connect@upskillnow.in